Overclock.net banner

The Tale of Ryzen and Firestrike: Problems Ahead?

12K views 31 replies 12 participants last post by  mtrai  
#1 ·
The Tale of Ryzen and Firestrike: Problems Ahead?

A few weeks back I spent a bunch of time benching my Ryzen setup. After many hours of benchmarking and documenting results, I found a handful of useful tweaks and general improvements that can be made however, there was one glaring issue that still doesn't make sense. The huge performance discrepancy when running specific core parking settings within the Windows 10 power plan settings in the Firestrike combined test.
image

I first noticed the issue when I was running batches of 3DMark runs to check ram frequency scaling. My scores would randomly drop by approximately 20% for no reason; I hadn't changed a single bios or windows setting for anything. I then ran a batch of tests to see how often this issue would occur, and found that approximately every 1.5 out of 5 runs my combined score would drop at the same settings (I ran a total of 20 tests at the same settings).

To keep this brief, this issue lead me down two paths. The first being the W10 power plan core parking setting and the second investigating whether or not core/CCX configuration had anything to do with the problem. For part one I exclusively used AMD's new Ryzen Power Plan, and simply adjusted the core parking values for testing purposes.

Test Setup:


- R7 1700 @ Stock
- Gigabyte AX370 Gaming 5 (F5G Bios)
- 2x8GB G.Skill DDR 3200 @ 3200 14-14-14-34 1T 1.35v
- EVGA GTX 1070 FTW2 @ Stock (381.65 WHQL)
- EVGA 750w Supernova G2
- Windows 10 Home 64-bit (Creators Update)

Part One


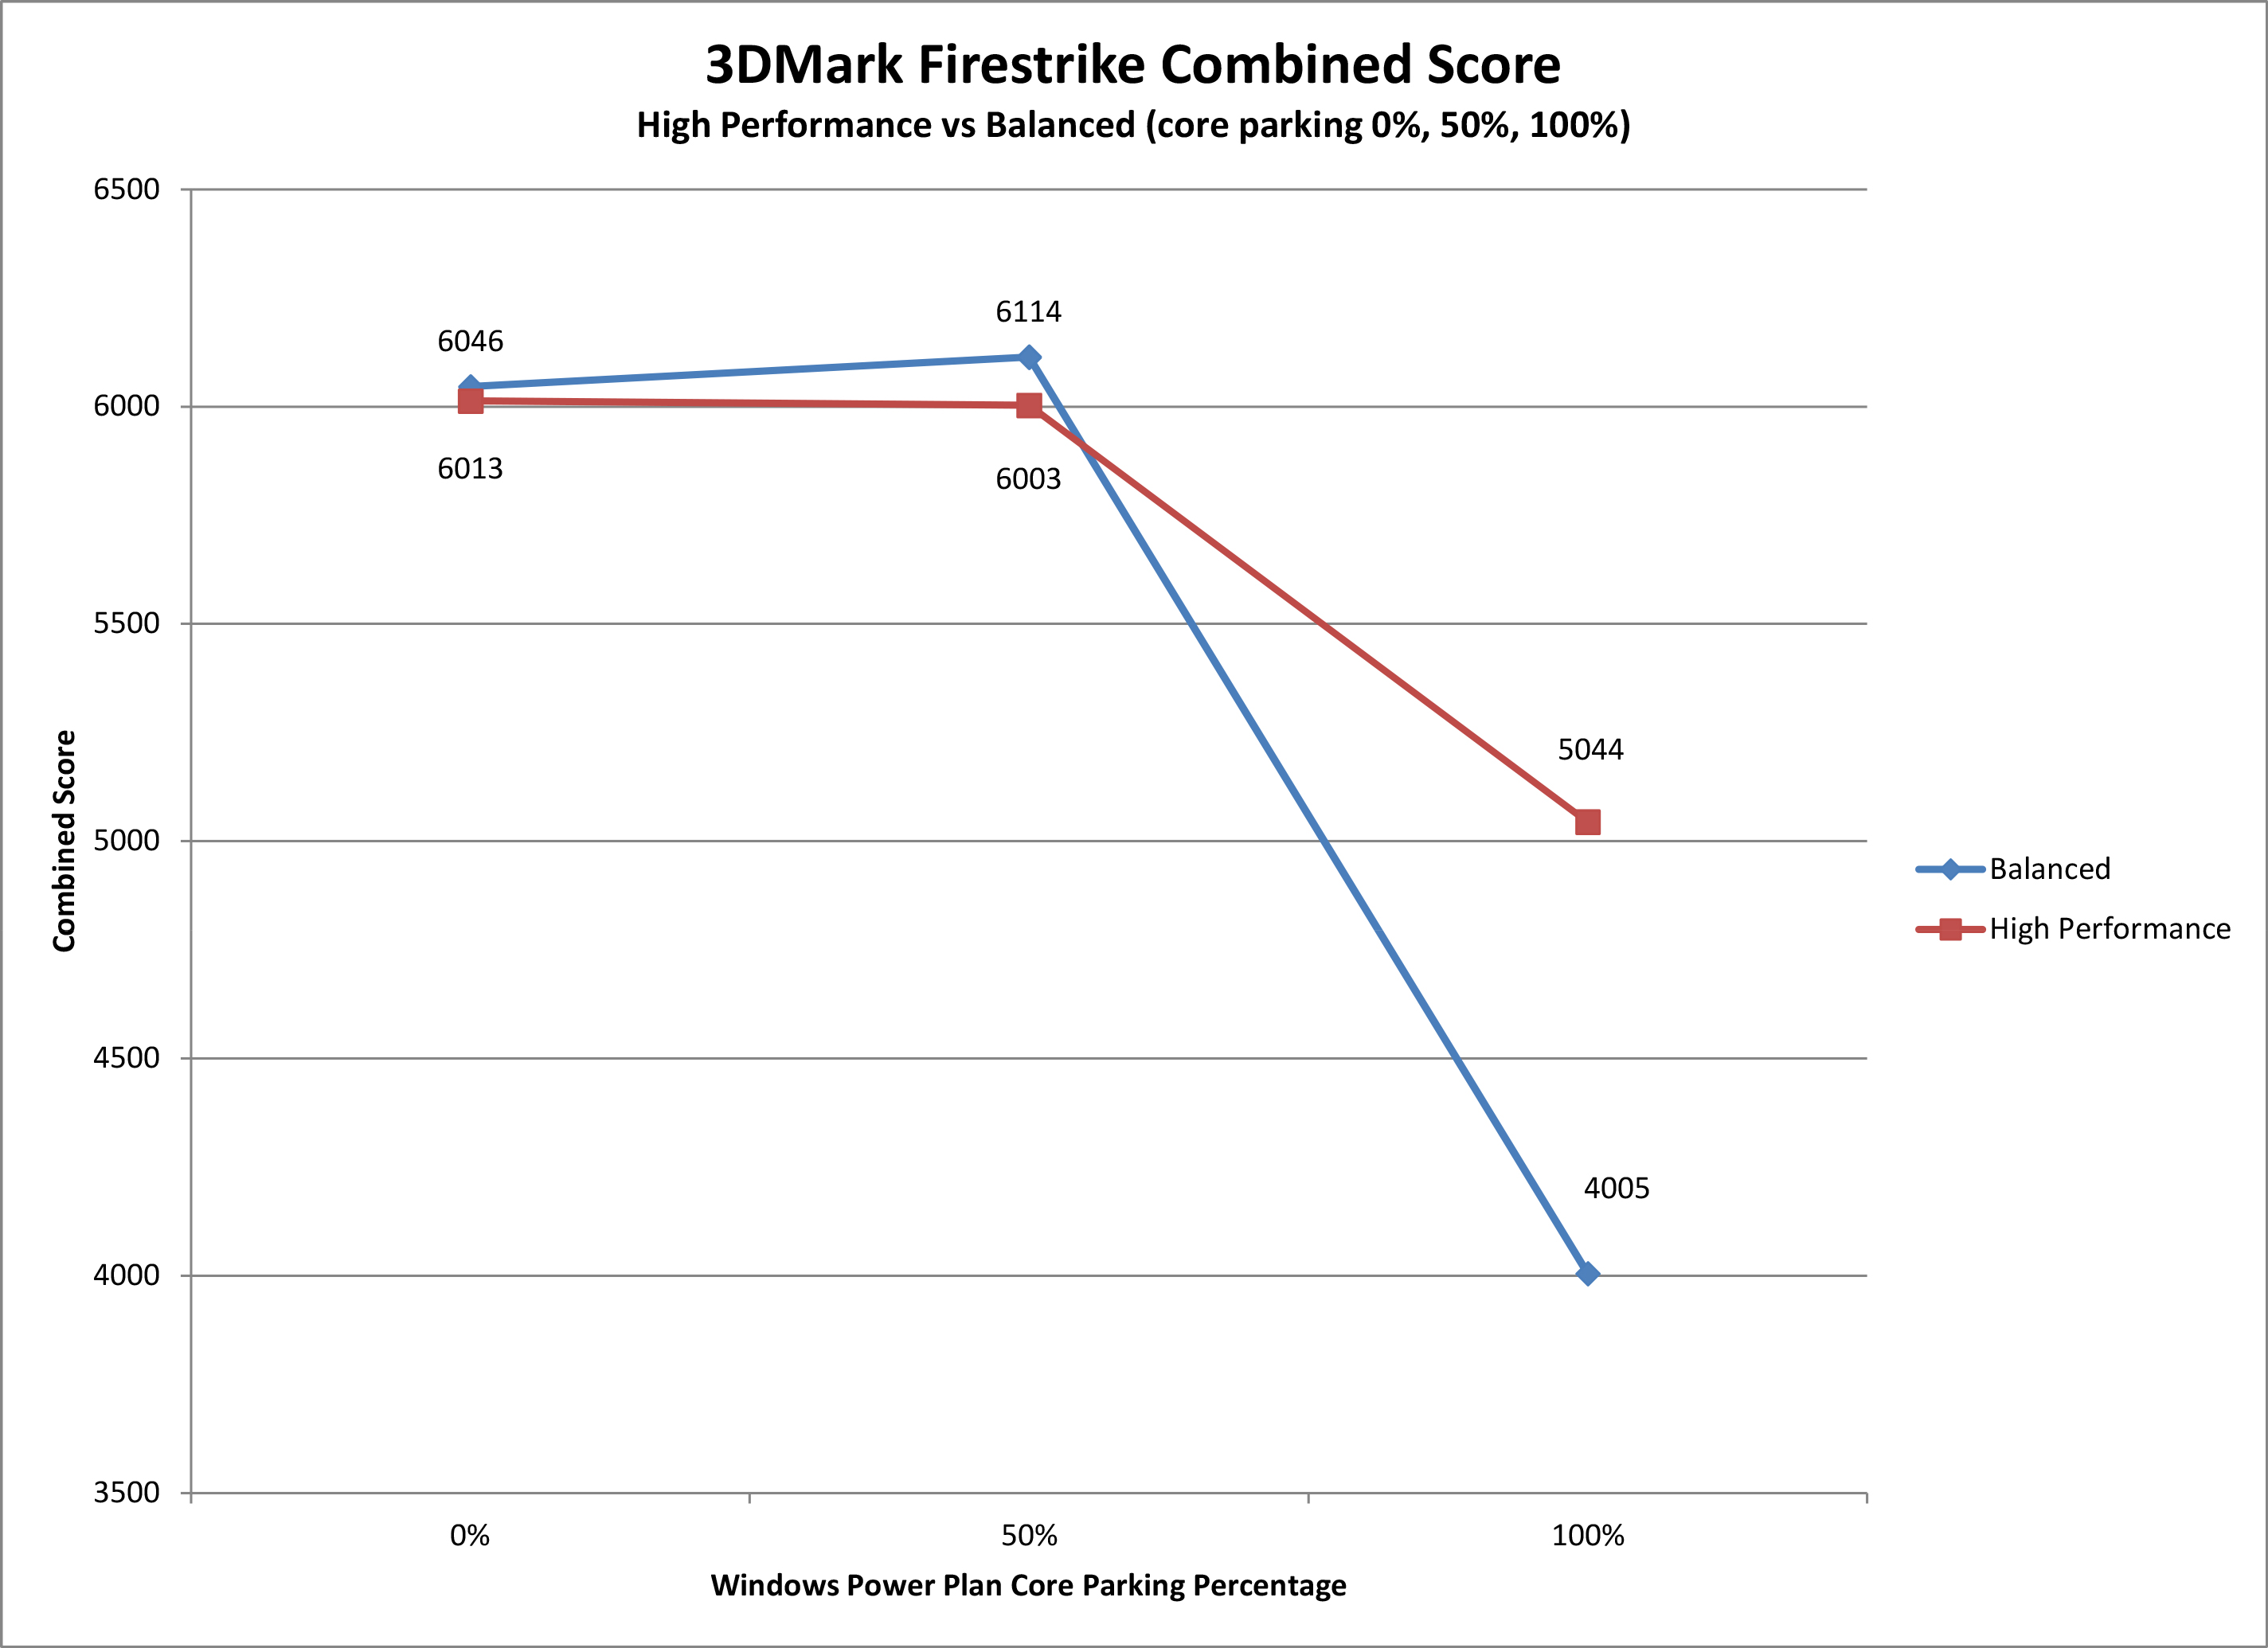
First we will look at how the Windows 10 core park settings affect the Firestrike Combined Score with the AMD Ryzen Power Plan. Below the Combined test was run three times with the stock R7 1700 at 0% (all cores parked) and at 100% (all cores unparked) via the W10 core parking option.


Here we can clearly observe one of the issues at hand. When W10 has all cores unparked (100% setting in power options), the Combined test performs signifcantly worse than with all cores parked. This behavior is only observed with both CCX enabled and 16 threads active, or the R7 1700 being at its' stock configuration and clock speeds. Performance drops on average by 22.5%, with an extreme delta of a 31% loss in performance. Is this due to threads being spread across the CCX? Let's find out.

Next I ran the same test but with the R7 1700 set to 2+2 and 4+0 two observe if latency due to threads being spread across the CCX was detrimental to performance. This was done using the downcore configuration options within the bios.


The results were VERY interesting to say the least. Not only had the behavior due to core parking been reversed, and performing like one would expect, there was almost no performance penalty due to cross CCX communication. With all the cores unparked the performance difference between the 2+2 and 4+0 configuration was 0.4%. The difference with all cores parked was 1%. Both of these values are what I consider to be within margin of error; CCX communication seems to incur no performance penalty.

It was starting to seem like the issue was directly related to how Firestrike itself was dealing with assigning threads and loads properly. This hypothesis seems to ring true when we take a look at performance across threads for each configuration. Thread assignment and loading was observed using the W10 task manager performance monitor.

Below we look at the difference in thread assignment and activity between all cores parked and unparked with the stock 1700.


With all cores parked, thread assignment is sequential from CPU0 to CPU15 with activity falling at CPU9 onward.


With all cores unparked, thread assignment is sporadic with the load spread unevenly across the 16 threads. Having all cores unparked also resulted in a consistently worse combined score, and with this uneven load/thread assignment it makes perfect sense.


Moving on to the 2+2 and 4+0, thread assignment and loading seems to be identical for each configuration. The major difference here being that again we see with all cores parked, thread assignment/load is sequential. When the cores were unparked, thread assignment was more sporadic, but loading was consistent between the 2+2 and 4+0 configuration. This is slightly different from the extremly sporadic loading and thread assignment we saw with the CPU configured for 4+4 with all cores unparked. Unfortunately there is no 8+0 Ryzen cpu to compare.

Now what does all of this mean? The most accurate conclusion I can make from this is that there are clearly some threading issues with the Firestrike combined test. Why Firestrike and not Windows you say? The proof is in the difference in thread loading with unparked cores and comparing different core configurations. Both the 2+2 and 4+0 core configurations show even loading scenarios and also show a performance improvement when unparking the cores. Meanwhile the opposite is true when unparking cores with a 4+4 configuration. Thread loading and assignment becomes sporadic, causing a drastic decrease in performance. The previous statement alone doesn't show it's an issue with Firestrike alone. What really seals the deal however, is when testing a benchmark optimized for highly threaded situations.

For this purpose I chose Cinebench, testing with all cores parked and unparked. After three runs for each core park setting, the scores, loading, and thread assignment was almost Identical. These observations fall in line with the statement AMD recently made about optimization for Ryzen being a per program effort, and not a Windows 10 scheduling issue.

Before I wrap up this portion of my mini review, I would again like to bring to your attention to the issue of random score drops on default W10/bios settings. After 12+ hours of testing, I have not found any leads, but my best hypothesis remains the issue is likely due to no optimization of the Ryzen architecture for Firestrike.

TLDR

- The CCX complex doesn't cause any notable performance loss (~1% worst case)
- Unparking cores through the W10 power plan shows a ~5% performance gain with 8 total Threads (2+2 or 4+0)
- Unparking cores through the W10 power plan with all 16 threads active can cause up to a 31% performance loss
- Firestrike doesn't appear to be well optimized for Ryzen; at least with all 16 threads active

Part Two


For the second part of this mini review I took some time benchmarking the performance differences between W10 power plan options, different core park settings with power plans, and how ram/infinity fabric frequency all affected the Firestrike combined score. Additional testing of physics score scaling with ram frequency was also tested.

Test Setup:


- R7 1700 @ Stock
- Gigabyte AX370 Gaming 5 (F5d Bios)
- 2x8GB G.Skill DDR 3200 @ multiple frequencies and timings
- EVGA GTX 1070 FTW2 @ Stock (376.98 WHQL)
- EVGA 750w Supernova G2
- Windows 10 Home 64-bit (Build 1607)


Increasing Firestrike Combined and Physics Scores: What worked

- Overclocking the CPU
- Overclocking the RAM/Infinity Fabric
- Unparking cores with 8 total threads (4+0 and 2+2)

Increasing Firestrike Combined and Physics Scores: What didn't work

- Switch between high and balanced modes @ the same core park settings
- enable Message System Interrupt for the Nvidia drivers
- unparking cores with 16 total threads (4+4)
- enabling maximum gpu performance in the Nvidia driver settings

** Feel free to make suggestions or corrections
*** Will edit in the future to showing some combined score scaling with CPU oc's
 
#2 ·
I'm assuming you're referring to the AMD balanced power plan mentioned in the new community update https://community.amd.com/community/gaming/blog/2017/04/06/amd-ryzen-community-update-3

You might want to link to the power plan: https://community.amd.com/servlet/JiveServlet/download/38-70650/Ryzen_Balanced_Power_Plan.zip

I think you're missing a value for DDR4-2933Mhz Firestrike Physics , but the graph looks pretty linear.

All in all it's a lot of insight into cross-CCX limitations (or lack thereof) for this particular application.
 
#3 ·
Quote:
Originally Posted by AlphaC View Post

I'm assuming you're referring to the AMD balanced power plan mentioned in the new community update https://community.amd.com/community/gaming/blog/2017/04/06/amd-ryzen-community-update-3

You might want to link to the power plan: https://community.amd.com/servlet/JiveServlet/download/38-70650/Ryzen_Balanced_Power_Plan.zip

I think you're missing a value for DDR4-2933Mhz Firestrike Physics , but the graph looks pretty linear.

All in all it's a lot of insight into cross-CCX limitations (or lack thereof) for this particular application.
You are correct and I've now clarified this in the original post, thank you. All testing in part one was done with the AMD Ryzen power plan, I simply adjusted the core parking settings for testing where necessary. I couldn't find where the last result went for DDR4 @ 2933, and was too tired by the time I finished last night to not let the linearity of the graph do the work
redface.gif


I think the most interesting thing is still that, when all 16 threads are unparked Firestrike has no clue how to spread the load and threading properly. The trend was only observed past 8 threads, maybe I should take a look at a 3+3 configuration to see if its strictly related to Firestrike having never seen an AMD cpu with more than 8 threads.
 
#4 ·
Well done looking into this. +REP

You should keep in mind that the performance discrepancy increases as the GPU gets more powerful as well. You should also map the Graphics and physics scores as the Combined score is changing and look for trends. It is possible that the physics and combined scores are increasing at the expense of pure graphics performance suggesting something other than the processing cores/threads being the primary cause.

A Ryzen with a 1080TI will also get a combined score of 6500-8000. The same hard "limit" trend is also apparent when using high end AMD cards such as a Fury. In comparison, the Intel platform averages combined scores of ~10000 with an i7-6900K and ~9000 with an i7-7700K with a 1080TI level single GPU.

In the r5 1600X reviews this morning, they are showing that the CPU + GPU performance is roughly the same as an an R7 with the same GPU at the same clock frequencies suggesting that the extra 2t/4c is enough to exceed/overwhelm a throughput limit somewhere else in the processing chain between CPU and GPU. We wont be able to work it out without experimentation like this though.

There has never been any possibility of CCX switching causing major 20-40% performance drops. It seems that no one ever bothered to do the maths to consider that the 0.00000006 seconds (60ns) additional latency in one out of every 4 inter CCX thread switches that happen 0.015seconds (15 milliseconds) apart is only ever going to create a minimal performance discrepancy. Threads are constantly pulling fresh data from system Ram as they continue to process instructions as all their required the data cant be in the cache all the time anyway. Even if it is having to recall a kilobyte that was in the other cache, it is only a penalty in tens of nanoseconds. Consider too that once a frame is gone off to the GPU, the CPU has to start processing the next frame almost from scratch so the impact is not cumulative.

I have also observed similar individual high graphics and CPU performance but poor CPU + GPU performance with an overclocked i7-2600 (PCIe 2.0) with a GTX1070 (Pascal has pushed the limits on PCIe 2 higher than ever before and I thgink is starting to show its limitations) and 6850K with SLI 1080TI cards. While the current generation Intel machines have a higher ceiling than Ryzen as it stands today, there is still a similar ceiling none the less. That has led me to think, is that the performance limits are more to do with the interconnects between components that are on die than specifically the processing cores/threads themselves. Faster Ram and subsequent Data Fabric improvements would also support that Idea.

You may also want to consider looking at the following areas:

  • Enabling/disabling Message Signalled Interrupts on the Nvidia card. I have observed a small 5% performance increase by enabling them with a 1080TI so there is some suggestion that the performance issues are at least partially related to Interrupt and DMA alignment. MSI removes the dual pathways and keeps things in sync.
  • Setting processor affinity to only the 8 primary cores vs all 16 threads in windows.
  • SMT on/off in bios
  • Using 109% REFCLK with lower CPU multiplier and one step lower Ram divider so that frequencies end up the same but you are using PCIe 2.0. The amount of difference should be relatively small. if it is 10-20% it tends to point the finger squarely at the Data fabric and not the processing cores
 
#5 ·
Quote:
Originally Posted by gtbtk View Post

Well done looking into this. +REP

You should keep in mind that the performance discrepancy increases as the GPU gets more powerful as well. You should also map the Graphics and physics scores as the Combined score is changing and look for trends. It is possible that the physics and combined scores are increasing at the expense of pure graphics performance suggesting something other than the processing cores/threads being the primary cause.

A Ryzen with a 1080TI will also get a combined score of 6500-8000. The same hard "limit" trend is also apparent when using high end AMD cards such as a Fury. In comparison, the Intel platform averages combined scores of ~10000 with an i7-6900K and ~9000 with an i7-7700K with a 1080TI level single GPU.

In the r5 1600X reviews this morning, they are showing that the CPU + GPU performance is roughly the same as an an R7 with the same GPU at the same clock frequencies suggesting that the extra 2t/4c is enough to exceed/overwhelm a throughput limit somewhere else in the processing chain between CPU and GPU. We wont be able to work it out without experimentation like this though.

There has never been any possibility of CCX switching causing major 20-40% performance drops. It seems that no one ever bothered to do the maths to consider that the 0.00000006 seconds (60ns) additional latency in one out of every 4 inter CCX thread switches that happen 0.015seconds (15 milliseconds) apart is only ever going to create a minimal performance discrepancy. Threads are constantly pulling fresh data from system Ram as they continue to process instructions as all their required the data cant be in the cache all the time anyway. Even if it is having to recall a kilobyte that was in the other cache, it is only a penalty in tens of nanoseconds. Consider too that once a frame is gone off to the GPU, the CPU has to start processing the next frame almost from scratch so the impact is not cumulative.

I have also observed similar individual high graphics and CPU performance but poor CPU + GPU performance with an overclocked i7-2600 (PCIe 2.0) with a GTX1070 (Pascal has pushed the limits on PCIe 2 higher than ever before and I thgink is starting to show its limitations) and 6850K with SLI 1080TI cards. While the current generation Intel machines have a higher ceiling than Ryzen as it stands today, there is still a similar ceiling none the less. That has led me to think, is that the performance limits are more to do with the interconnects between components that are on die than specifically the processing cores/threads themselves. Faster Ram and subsequent Data Fabric improvements would also support that Idea.

You may also want to consider looking at the following areas:
  • Enabling/disabling Message Signalled Interrupts on the Nvidia card. I have observed a small 5% performance increase by enabling them with a 1080TI so there is some suggestion that the performance issues are at least partially related to Interrupt and DMA alignment. MSI removes the dual pathways and keeps things in sync.
  • Setting processor affinity to only the 8 primary cores vs all 16 threads in windows.
  • SMT on/off in bios
  • Using 109% REFCLK with lower CPU multiplier and one step lower Ram divider so that frequencies end up the same but you are using PCIe 2.0. The amount of difference should be relatively small. if it is 10-20% it tends to point the finger squarely at the Data fabric and not the processing cores
Thank you for the comments!

The graphics score remains consistent during test, or at least within margin of error never exceeding a +/- 50 pt swing. I will take a closer looking at the physics score over multiple runs, but from what I can remember during the initial batch test the physics score remained relatively consistent as well.

Enabling/disabling MSI didn't change the score for the isolated GPU performance or the combined score; the tool I used to enable/disable could be a problem if you have personally seen a benefit however.

What doesn't make much sense to me is that the combined test provides the system with a multi-threaded load, yet looks to favor single core performance and higher IPC (much stronger combined scores with higher clocked intel parts). Judging from the physics score alone, if the work load was well threaded, an R7 should have some kind of advantage over say a 7700k. Unfortunately it doesn't, and even broadwell-e/haswell-e show the same weakness even though they can keep up with the newer Kaby Lake based 7700k due to higher achievable clock speeds. Is this just a limitation due to DX11/3DMark Code?

I will definitely take a look at processor affinty, smt, and take a second look at MSI. I unfortunately don't have a board that allows for BCLK adjustment, however I can due some testing enabling older gen pci-e speeds.

As a side note I was able to achieve up to a combined score of 7866. For reasons still unclear, the CPU is definitely bottle necking higher end GPUs; 1070, 1080, Titan X m/p, 1080 Ti and so on....

 
#6 ·
Quote:
Originally Posted by rv8000 View Post

Thank you for the comments!

The graphics score remains consistent during test, or at least within margin of error never exceeding a +/- 50 pt swing. I will take a closer looking at the physics score over multiple runs, but from what I can remember during the initial batch test the physics score remained relatively consistent as well.

Enabling/disabling MSI didn't change the score for the isolated GPU performance or the combined score; the tool I used to enable/disable could be a problem if you have personally seen a benefit however.

What doesn't make much sense to me is that the combined test provides the system with a multi-threaded load, yet looks to favor single core performance and higher IPC (much stronger combined scores with higher clocked intel parts). Judging from the physics score alone, if the work load was well threaded, an R7 should have some kind of advantage over say a 7700k. Unfortunately it doesn't, and even broadwell-e/haswell-e show the same weakness even though they can keep up with the newer Kaby Lake based 7700k due to higher achievable clock speeds. Is this just a limitation due to DX11/3DMark Code?

I will definitely take a look at processor affinty, smt, and take a second look at MSI. I unfortunately don't have a board that allows for BCLK adjustment, however I can due some testing enabling older gen pci-e speeds.

As a side note I was able to achieve up to a combined score of 7866. For reasons still unclear, the CPU is definitely bottle necking higher end GPUs; 1070, 1080, Titan X m/p, 1080 Ti and so on....

I am not sure If you have seen the 3dmark technical guide that details what all the tests are actually doing and how the scores are calculated.

http://www.futuremark.com/downloads/3DMark_Technical_Guide.pdf

Ryzen performance has certainly improved in the last month with all the bios updates and better memory support etc, however, there is a consistent theme about in Ryzen tests since its release. That is that Gaming benchmarks are falling behind the competing Intel Boxes. Of course games are about Fun and fun is emotional so the world has focussed on "Ryzen = bad games" and not looked at it from the angle that caused them to use game performance as a benchmark in the first place. It is only testing what happens when you put both a CPU together with a Powerful GPU under load at the same time -- the PC doesn't know that you are running a game as opposed to running a blender rendering and the CPU threads dont know if you are playing GTA V or running Cinebench. If you test Cinebench, it beats the best from Intel in multicore and matches most in single core scores.

Like the Cinebench run, If you run the Firestrike Physics test, It compares favorably with Intel machines. It cannot be the CPU in isolation, you have just proved that with cinebench and now the firestrike test. We also know what to expect from a GTX1070, 1080Ti, Titan X etc because of the history of systems from before Ryzen's release. The Ryzen Firestrike Graphics (heavy GPU load and very light CPU load unlike a game) scores on Ryzen are similar to the same firestrike runs done on an Intel Box. So the problem is not GPU or GPU/Driver in isolation.

If you benchmark GTA V, or Tomb Raider or many of the other complex games which have loads of calculations together with complex graphics being created together, Just like the Combined score in Firestrike, you observe the performance anomalies that get worse the more powerful the graphics card gets. Basically, solve the low combined scores running on Ryzen problem and you also solve the slow gaming problem because the CPU+GPU are performing similar concurrent workloads.

Given what we already know about the components operating in Isolation, The only things left that it could only be are either the "neural net artificial Intelligence" that AMD claims as a Positive feature, artificially capping performance when the Chip wants to access the PCIe bus. I think that is unlikely, as most of that is supposed to be disabled when you Overclock the CPU. Or, the data throughput capacity to either the memory controller/PCIe bus is being limited by some sort of ceiling or restriction that is limiting the communication between CPU and GPU. the thing that connects everything, including the CCX modules is the Data Fabric. The Bandwidth runs at 32Bytes per cycle so it is absolutely tied to the memory frequency that sets the number of cycles available.

Faster cores or different IPC are not the major issue in the anomalies we are seeing here, a 6900K performs roughly the same in IPC and has the same numbers of threads and cores. Both Ryzen and the 6900K perform comparably well in the non gaming environments when there is no competing load on resources and yet the 6900K will score 25% better than a Ryzen chip in the combined test or games. A 7700K has better IPC, 25% more Cycles to use and is built on the monolithic Intel architecture that has been around forever and doesn't have the apparent bandwidth restrictions.

For the MSI settings, if the tool you have is called MSI_UTIL, all it is doing is adding a DWORD value to the registry entry for the graphics card. That is the same thing if you do it manually. The reason I suggested it is because it helps to streamline the communication load on the Fabric when you are concurrently running a CPU and GPU.

The reason I suggested the affinity and SMT tests, is because less threads = less concurrent demands on the memory controllers to service each thread. Less concurrent traffic on the data fabric means less contention for bandwidth.

Increased memory frequency has helped alleviate some of the problems so far but currently anything over 3200 Mhz is being compromised by the PCIe bus being reduced to 2.0 speeds when you start increasing the REFCLK above 104.8 Mhz. Hopefully the next round of bioses in May give the promised access to the faster Memory dividers such as native 3600Mhz so that you can also have PCIe 3.0 at the same time increasing the available bandwidth all along the chain. It will have to get to a point sometime where the available bandwidth matches what the hardware can throw at it and the problem will go away. I have no idea at what point that will be though.

There is one other thing that could help resolve the problem, and that is tuning certain voltages on the motherboard. On my Z68/i7-2600, I found that I could tune performance in Firestrike with small adjustments to the VCCIO and CPUPLL voltages. The PLL Voltage on Intel basically fine tunes the various device clocks.

I have never heard of anyone experimenting with the SOC PLL voltage setting in the Ryzen forums so I do not know how beneficial it will be It may be worth running a range of tests increasing the PLL voltage, a single step at a time and testing to see what happens with the FS scores. Dont give up if the first step up doesn't show improvement. You may need 3 or 4 incremental increases. This platform, combined with new powerful GPUs, is so new that AMD and the MB vendors may have under specified the voltage slightly and a small tune up will solve the problem altogether.
 
#7 ·
One thing I should note from a few of us testing: What acts up in Windows 10 doesn't appear in Windows 7.
Meaning, if you run it in W7 the combined score lands right where we expect it.

I've been trying to get ahold of CodeXL 2.3 to see if we can better profile the Combined test and get a better idea of CPU utilization behind the scenes.
2.2 might work also, but 2.3 was mentioned in the slides that I saw for Ryzen profiling.
Unfortunately it's on hold until I get more time past benchmarks but if someone wants to try I'd start there.
 
#8 ·
Quote:
Originally Posted by garwynn View Post

One thing I should note from a few of us testing: What acts up in Windows 10 doesn't appear in Windows 7.
Meaning, if you run it in W7 the combined score lands right where we expect it.

I've been trying to get ahold of CodeXL 2.3 to see if we can better profile the Combined test and get a better idea of CPU utilization behind the scenes.
2.2 might work also, but 2.3 was mentioned in the slides that I saw for Ryzen profiling.
Unfortunately it's on hold until I get more time past benchmarks but if someone wants to try I'd start there.
Were any power plan options changed during testing on windows 7 to rule out whether or not it is an OS issue in terms of scheduling/threading; changing core park settings?

The main concern, in terms of performance loss, is that with more than 8 threads enabled unparking all of the cores in windows 10 will consistently decrease performance by 20-30%. There was no performance loss with only 8 threads enabled (2+2 and 4+0) when unparking cores.
 
#9 ·
Quote:
Were any power plan options changed during testing on windows 7 to rule out whether or not it is an OS issue in terms of scheduling/threading; changing core park settings?
I've personally tested on balanced and high performance with nothing to explain it in Windows 10. Windows 7 findings I can direct you to the person I've been talking with - Keith May (@KeithPlaysPC on Twitter)

Here's a side-by-side of the two that puzzled us. Same h/w, same settings (BIOS OC) - O/S difference.
http://www.3dmark.com/compare/fs/11996392/fs/12003416

Again, can do a lot more testing once I'm done with XDA review. But figured others might be able to help.
 
#10 ·
Quote:
Originally Posted by garwynn View Post

One thing I should note from a few of us testing: What acts up in Windows 10 doesn't appear in Windows 7.
Meaning, if you run it in W7 the combined score lands right where we expect it.

I've been trying to get ahold of CodeXL 2.3 to see if we can better profile the Combined test and get a better idea of CPU utilization behind the scenes.
2.2 might work also, but 2.3 was mentioned in the slides that I saw for Ryzen profiling.
Unfortunately it's on hold until I get more time past benchmarks but if someone wants to try I'd start there.
Have you got a couple of of W7 Firestrike benchmark runs that I could take a look at please?

I know that windows 10 has changed a number of things under the hood compared to windows 7 and there are extras like GameDVR that need to be turned off as they are enabled by default in w10. Now there is also game mode that does things that is not fully understood. It could be almost anything that has been added to windows that is strangling performance. Unfortunately, in spite of win 7 being a great OS, DX12 will keep making inroads and Win 7 will become obsolete. Other than acknowledging that Win 7 offers better immediate performance gratification, it is better as a whole not expending energy trying to go backwards but to identify what is happening in win 10.

Unfortunately CodeXL only works with an AMD GPU installed. Not much help for owners of Nvidia Cards.

GPUView that comes with the windows performance toolkit may, on the other hand be something to try. It may be very informative to run a trace on both a win 7 and a win 10 machine
 
#11 ·
Quote:
Originally Posted by gtbtk View Post

Have you got a couple of of W7 Firestrike benchmark runs that I could take a look at please?

I know that windows 10 has changed a number of things under the hood compared to windows 7 and there are extras like GameDVR that need to be turned off as they are enabled by default in w10. Now there is also game mode that does things that is not fully understood. It could be almost anything that has been added to windows that is strangling performance. Unfortunately, in spite of win 7 being a great OS, DX12 will keep making inroads and Win 7 will become obsolete. Other than acknowledging that Win 7 offers better immediate performance gratification, it is better as a whole not expending energy trying to go backwards but to identify what is happening in win 10.

Unfortunately CodeXL only works with an AMD GPU installed. Not much help for owners of Nvidia Cards.

GPUView that comes with the windows performance toolkit may, on the other hand be something to try. It may be very informative to run a trace on both a win 7 and a win 10 machine
AFAIK CodeXL will work with both GPU manus. Can certainly download 2.2 and verify later.
W7 tests, unfortunately, will have to hold until done with review benchmarks. Again, might want to try pinging Keith though and see if he's willing/able since his review is done.
 
#12 ·
Quote:
Originally Posted by garwynn View Post

Quote:
Originally Posted by gtbtk View Post

Have you got a couple of of W7 Firestrike benchmark runs that I could take a look at please?

I know that windows 10 has changed a number of things under the hood compared to windows 7 and there are extras like GameDVR that need to be turned off as they are enabled by default in w10. Now there is also game mode that does things that is not fully understood. It could be almost anything that has been added to windows that is strangling performance. Unfortunately, in spite of win 7 being a great OS, DX12 will keep making inroads and Win 7 will become obsolete. Other than acknowledging that Win 7 offers better immediate performance gratification, it is better as a whole not expending energy trying to go backwards but to identify what is happening in win 10.

Unfortunately CodeXL only works with an AMD GPU installed. Not much help for owners of Nvidia Cards.

GPUView that comes with the windows performance toolkit may, on the other hand be something to try. It may be very informative to run a trace on both a win 7 and a win 10 machine
AFAIK CodeXL will work with both GPU manus. Can certainly download 2.2 and verify later.
W7 tests, unfortunately, will have to hold until done with review benchmarks. Again, might want to try pinging Keith though and see if he's willing/able since his review is done.
I installed 2.2 on my laptop to have a look and it says "cannot find AMD CPU". Maybe 2.3 has been opened up?
 
#13 ·
I have noticed is a trend in the Ryzen review benchmark lists. That is the FPS results for 1600x and any of the r7 chips in a given game all cut off at pretty much the same score. That trend includes the Firestrike combined results where the vast majority of runs are cut off at about 6500. Of course there are also outliers that are above that average as well but this conversation started because of the tendency for mid 6000 level scores that don't seem to make sense given the Graphics and Physics scores that go with it.

Better support for faster dual bank single row memory has improved since release with better bios revisions up to 3200Mhz although latency is still lagging a bit behind what can be seen with an Intel board. Dual Rank memory kits have still been limited to 2400 or at best 2667Mhz for the most part. The general consensus is that the Data Fabric gets more bandwidth from the extra clock cycles and I believe that it certainly does, however, in spite of the improvements to date, it is still under performing the equivalent Intel platforms memory performance and not giving us the results that we completely expected.

I did find these results on the computerbase.de webside where they reviewed different memory speeds with ryzen and saw that the "hard stop" trend also continues

Image

We have also observed that windows 7 and in other Linux bench marks that can be compared to windows like Geekbench also perform better than the same/similar software on Windows 10.

The major difference that I can see between windows 7 and windows 10 is that Win10 has adopted the WDDM 2.0 graphics driver model. What WDDM 2.0 is doing is implementing a thing called GPUMMU as the way memory in the system is addressed and presented for use. Instead of the driver allocating physical memory address space to the system as it did in win 7, it creates a virtualized range of addresses to allow the system to make best use of the memory addresses available for communications between the GPU and the rest of the system. I am not certain about GPUMMU, however, I do know that other virtualization systems really prefer the lowest latency memory as by its nature, It has to add some overhead on top that increases the base latency as well. In the other virtualized environments, there is a tipping point where the base latency times start to impact the performance of the virtualized system on top of it. That point may well be between the Intel Platform and the Ryzen platform.

Looking through the firestrike and time spy results, I noticed another trend that I didn't expect to see. I noticed that many of the fastest Ryzen firestrike runs that scored into the 8000s on the combined scores were running mostly 2x16GB 32GB Ram at 2400 or 2667Mhz Ram and not 16GB at 3200+Mhz.

The problem from the beginning is that the Framerate limits are being hampered by a limitation of throughput between the CPU and the GPU. What I am about to say needs validation that I cannot do myself, but it is starting to look to me that Ryzen is making up for the higher latencies impact on the GPUMMU with the extra interleaving that is available from running dual rank memory or, to a lesser extent, 4 x single rank sticks even if it is at a lower clock rate.

Has anyone got some way of comparing a 16GB Single rank system with a 32gb Dual Rank memory system?
 
#14 ·
Quote:
Originally Posted by gtbtk View Post

I have noticed is a trend in the Ryzen review benchmark lists. That is the FPS results for 1600x and any of the r7 chips in a given game all cut off at pretty much the same score. That trend includes the Firestrike combined results where the vast majority of runs are cut off at about 6500. Of course there are also outliers that are above that average as well but this conversation started because of the tendency for mid 6000 level scores that don't seem to make sense given the Graphics and Physics scores that go with it.

Better support for faster dual bank single row memory has improved since release with better bios revisions up to 3200Mhz although latency is still lagging a bit behind what can be seen with an Intel board. Dual Rank memory kits have still been limited to 2400 or at best 2667Mhz for the most part. The general consensus is that the Data Fabric gets more bandwidth from the extra clock cycles and I believe that it certainly does, however, in spite of the improvements to date, it is still under performing the equivalent Intel platforms memory performance and not giving us the results that we completely expected.

I did find these results on the computerbase.de webside where they reviewed different memory speeds with ryzen and saw that the "hard stop" trend also continues

Image

We have also observed that windows 7 and in other Linux bench marks that can be compared to windows like Geekbench also perform better than the same/similar software on Windows 10.

The major difference that I can see between windows 7 and windows 10 is that Win10 has adopted the WDDM 2.0 graphics driver model. What WDDM 2.0 is doing is implementing a thing called GPUMMU as the way memory in the system is addressed and presented for use. Instead of the driver allocating physical memory address space to the system as it did in win 7, it creates a virtualized range of addresses to allow the system to make best use of the memory addresses available for communications between the GPU and the rest of the system. I am not certain about GPUMMU, however, I do know that other virtualization systems really prefer the lowest latency memory as by its nature, It has to add some overhead on top that increases the base latency as well. In the other virtualized environments, there is a tipping point where the base latency times start to impact the performance of the virtualized system on top of it. That point may well be between the Intel Platform and the Ryzen platform.

Looking through the firestrike and time spy results, I noticed another trend that I didn't expect to see. I noticed that many of the fastest Ryzen firestrike runs that scored into the 8000s on the combined scores were running mostly 2x16GB 32GB Ram at 2400 or 2667Mhz Ram and not 16GB at 3200+Mhz.

The problem from the beginning is that the Framerate limits are being hampered by a limitation of throughput between the CPU and the GPU. What I am about to say needs validation that I cannot do myself, but it is starting to look to me that Ryzen is making up for the higher latencies impact on the GPUMMU with the extra interleaving that is available from running dual rank memory or, to a lesser extent, 4 x single rank sticks even if it is at a lower clock rate.

Has anyone got some way of comparing a 16GB Single rank system with a 32gb Dual Rank memory system?
I'll try and find someone with the Gigabyte G5 and some dual rank memory in the R7 owners thread and give them a pm. Very interesting hypothesis! +
 
#16 ·


i get better score with 4 cores disabled
 
#17 ·
I have made an observation that you may find interesting in this context.

When you run a benchmark, particularly one that runs better with SMT turned off. Have a look at the per core utilization.

The Even numbered Logical CPUs are CPU0 and the Odd numbered ones are CPU1 on each physical processor.

I have noticed that for what ever reason, many of the games that perform poorly compared to an Intel machine load up the last available logical CPU and also load up the second last cpu and to a lesser extent, a few low numbered cpu cores. By default on an r7 Ryzen, The busy core is Core8/CPU1 (one of the SMT cpus). If you use CPU affinity and disable that very last CPU for the game allowing it access to 15 logical CPUs instead of 16, the load appears to end up being better balanced across all the CPU cores and performance improves.

I am not sure if the windows scheduler or graphics driver is assuming that all cores on an AMD Ryzen chip are the same when in fact the SMT cores are only able to do about 1/4 the work of the primary logical CPU if both have a load or if the algorithm counts available CPUs and just keeps wrapping around once it gets to the last available cpu. It is possible that 15 available cpus wraps around to co-incidentally allocate threads more to the primary cores instead of the smt ones.
 
#18 ·


  • Rep+
Reactions: NightAntilli
#19 ·
Its an old thread, but i came across it and i am interested in this whole topic.
Has something changed in the meantime? I compared Zen Based CPU on HWBot in Timespy and Firestrike and i was wondering what is causing the "worse" performance than comparable intel CPUs.

Is it simply 3D Mark not working properly with Zen based CPUs, is it that simple?
 
#20 ·
Quote:
Originally Posted by Hulio225 View Post

Its an old thread, but i came across it and i am interested in this whole topic.
Has something changed in the meantime? I compared Zen Based CPU on HWBot in Timespy and Firestrike and i was wondering what is causing the "worse" performance than comparable intel CPUs.

Is it simply 3D Mark not working properly with Zen based CPUs, is it that simple?
yes i asked the 3dmark support and they told me to go test timespy insted
 
#22 ·
The combined test has been the downfall of all the zen based CPUs. The Infinity fabric that connects the CCX modules to teh memory and teh PCIe controllers on a Ryzen R7 is impacted with contention issues. Threadripper, on top of the issues that the R7s have, the GPU is only connected directly to 8c/16th on one of the dies. The cores on the other die has to traverse the infinity Fabric between the dies and suffers from even more latency overhead.

The total score on Firestrike does not really take the physics score into account directly, it only really counts in terms of the CPUs contribution in the combined tests. 7700K CPUS were doing 14,000 physics compared to an R7 1700 getting about 20,000 but a 7700K would kill the Ryzen in the combined score as an example.

What you could try is managing the CPU affinity, setting the affinity to only run Firestrike threads on the cores that reside on the die directly connected to the GPU. Cpu0-cpu15 connect to PCIE x16 slot 1, high numbered CPUs connect to the second x16 slot on the motherboard. The Physics score will likely be lower but the combined score should improve somewhat.

As a follow on of what I just said, many games on both Ryzen and Threadripper, if left to their own devices, for what ever reason will load up the very last logical CPU, which is an SMT secondary CPU, to 100% and leaves a lot of the other mid numbered CPU cores idle or lightly loaded. If you set the affinity to use all cores except the last SMT one, the system spreads CPU load more evenly across the rest of the CPU cores helping to improve gaming performance. I obviously have not tested every scenario but I suspect that the last CPU thread running at 100% is the reason that some games would show improvements with SMT off but none of the reviewers ever bother to take a look at individual core utilization during the benchmarks

I have not had the opportunity to test this against Firestrike so I only making an educated guess here. Assuming that you are using a single GPU in slot 1, on both Ryzen and Threadripper systems, I would suggest try setting CPU affinity to only use the cpu0-14 turning affinity off to cpu15 (and above on thread ripper).

If you want to try it, Process Lasso is a paid app that will automate the thread management. This utility is free and basically do the same job. https://www.bill2-software.com/processmanager/download-en.shtml
 
#23 ·
Hi gtbtk

Thanks for the insight!

Part of my doubts about the last test results are that, when I fire up The Witcher 3 on a stock TR cpu, it is giving me one or two frames less than my 5960X gave me at 4.5GHZ...so it seems actual gaming (from my small sample of one) is not hit so badly. Makes Firestrike a less than representative test on this new platform?

I will have to try Game mode on the CPU...and I'll see if I can do some affinity work along the lines you suggest!

:)
 
#24 · (Edited)
It's not just a Ryzen issue but an AMD issue. Firestrike has been trashing AMD CPUs for many years. Here is FX loads in Firestrike back in 2015.
 
#27 ·
I cant comment on pre Ryzen cpus but this may also hold true there.

Fabric bandwidth and latency aside, The performance of the AMD PCIe controllers on both Ryzen and Vega are looking to me to be central to the disappointing performance in certain situations.

ON the same PC, Vega 64 gets beaten by GTX 1080 at 1080p, pulls level at 1440p and starts pulling ahead at 4K. That says to me that the Vega GPU is a stronger chip than the GTX1080 but being strangled by the PCIe communications. It is possible of course, that Intel, to get better performance, is doing a "cheat" and not sticking exactly with the PCIe standards and AMD is. Spectre is leveraging a cheat like that.
 
#26 ·
IMO the issues you are seeing are likely due to Firestrike trying to avoid hyperthreading during that test. You will notice this because if you watch hardware monitor, half the cores (at least on my threadripper machine) show up as 0.0% usage. This happens for me at a fixed 4.1 GHz OC and a fixed clock speed on my GPU. I bet if hyperthreading were utilized, the score (and framerate) would shoot up.
 
#28 ·
I've been battling with this combined score issue for some time. As an example, I did the run below with my 2700X running 4.3ghz. I got a pretty okay Combined score and even the graphics not that bad.

https://www.3dmark.com/fs/15391797

The you take the next run I did while my 2700X was clocked at 4.9ghz on Dry Ice.... pretty sad when the combined and graphic score is lower than the cpu at 4.3ghz.

https://www.3dmark.com/fs/15410915

I use a application to do core parking and play around with it, but I'll uninstall it and play around with the core parking in windows itself.