

Over the last couple of days resp. weeks I've been working with the Curve Optimizer for Ryzen processors a bit more, but I hadn't found a good way to test the settings for stability. CineBench single threaded almost always worked fine, and getting Prime95 stable with load on all cores was also relatively quick. Waiting for crashes while idling or while playing a game wasn't so appealing either, and on Reddit someone even suggested using the Windows Repair as some kind of stability test... that didn't seem like a good idea to me.
So this sparked the idea for this tool. It's a PowerShell script which starts up an instance of Prime95 with only a single worker thread, stressing only a single physical CPU core. And it cycles through all the available cores after an adjustable time, so that you can run this tool e.g. over night, and then the next day you can check which cores have run fine and which ones have thrown an error in Prime95.
By now it looks polished enough for a release, however so far I'm the only one who has tested it, so additional reports are welcome.
You can find it here:

 github.com
To execute it, simply double click the "Run CoreCycler.bat".
And be sure to read the included readme.txt as well as the config.ini (resp. config.default.ini) to get a grasp of what settings you can change.
(Note: the config.ini will be auto-generated on the first start from the config.default.ini)
Screenshots of the script in action:
![Blue Computer Font Screenshot Display device]()
![Font Screenshot Electronic device Computer Multimedia]()
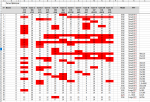
And here's an example for a summary, this is how the testing went for me during development. As you can see, this still takes quite some time to get stable. (And no, the summary will not be generated automatically, you'll still have to do this yourself") ):
):
![Rectangle Font Material property Parallel Pattern]()
Here's an excerpt from the readme.txt
This little script will run Prime95 with only one worker thread and sets the affinity of the Prime95 process alternating to each physical core, cycling through all of them. This way you can test the stability of your Curve Optimizer setting for each core individually, much more thoroughly than e.g. with Cinebench or the Windows Repair, and much easier than manually setting the affinity of the process via the Task Manager.
It will still need a lot of time though. If for example you're after a 12h "prime-stable" setup which is common for regular overvlocks, you'd need to run this script for 12x12 = 144 hours on a 5900X with 12 physical cores, because each core is tested individually, and so each core also needs to complete this 12 hour test individually. Respectively, on a 5600X with its 6 physical cores this would be "only" 6x12 = 72 hours.
Unfortunately such an all-core stress test with Prime95 is not effective for testing Curve Optimizer settings, because the cores cannot boost as high if all of them are stres tested, and therefore you won't be able to detect instabilities that occur at a higher clock speed. For example, with my CPU I was able to run a Prime95 all-core stress test for 24 hours with an additional Boost Override of +75 MHz and a Curve Optimizer setting of -30 on all cores. However, when using this script, and with +0 MHz Boost Override, I needed to go down to -9 on one core to have it run stable (on the other hand, another core was still happy with a -30 setting even in this case).
When you start the script for the first time, it will copy the included config.default.ini to config.ini, in which you then can change various settings, e.g. which mode Prime95 should run in (SSE, AVX, AVX2, CUSTOM, where SSE causes the highest boost clock, because it's the lightest load on the processor of all the settings), how long an individual core should be stressed for before it cycles to the next one, if certain cores should be ignored, etc. For each setting there's also a description in the config.ini file.
As a starting point you could set the Curve Optimizer to e.g. -15 or -20 for each core and then wait and see which core runs through fine and which throws an error. Then you could increase the setting for those that have thrown an error by e.g. 2 or 3 points (e.g. from -15 to -13) and decrease those that were fine by 2 or 3 further into the negative (-15 to -17). Once you've crossed a certain point however there is no way around modifying the value by a single point up/down and letting the script run for a long time to find the very last instabilities.
By the way, it is intended that only one thread is stressed for each core if Hyperthreading / SMT is enabled, as the boost clock is higher this way, compared to if both (virtual) threads would be stressed. However, there is a setting in the config.ini to enable two threads as well.
So this sparked the idea for this tool. It's a PowerShell script which starts up an instance of Prime95 with only a single worker thread, stressing only a single physical CPU core. And it cycles through all the available cores after an adjustable time, so that you can run this tool e.g. over night, and then the next day you can check which cores have run fine and which ones have thrown an error in Prime95.
By now it looks polished enough for a release, however so far I'm the only one who has tested it, so additional reports are welcome.
You can find it here:
Releases · sp00n/CoreCycler
Script to test single core stability, e.g. for PBO & Curve Optimizer on AMD Ryzen or overclocking/undervolting on Intel processors - sp00n/CoreCycler
github.com
To execute it, simply double click the "Run CoreCycler.bat".
And be sure to read the included readme.txt as well as the config.ini (resp. config.default.ini) to get a grasp of what settings you can change.
(Note: the config.ini will be auto-generated on the first start from the config.default.ini)
Screenshots of the script in action:


And here's an example for a summary, this is how the testing went for me during development. As you can see, this still takes quite some time to get stable. (And no, the summary will not be generated automatically, you'll still have to do this yourself
):
Here's an excerpt from the readme.txt
This little script will run Prime95 with only one worker thread and sets the affinity of the Prime95 process alternating to each physical core, cycling through all of them. This way you can test the stability of your Curve Optimizer setting for each core individually, much more thoroughly than e.g. with Cinebench or the Windows Repair, and much easier than manually setting the affinity of the process via the Task Manager.
It will still need a lot of time though. If for example you're after a 12h "prime-stable" setup which is common for regular overvlocks, you'd need to run this script for 12x12 = 144 hours on a 5900X with 12 physical cores, because each core is tested individually, and so each core also needs to complete this 12 hour test individually. Respectively, on a 5600X with its 6 physical cores this would be "only" 6x12 = 72 hours.
Unfortunately such an all-core stress test with Prime95 is not effective for testing Curve Optimizer settings, because the cores cannot boost as high if all of them are stres tested, and therefore you won't be able to detect instabilities that occur at a higher clock speed. For example, with my CPU I was able to run a Prime95 all-core stress test for 24 hours with an additional Boost Override of +75 MHz and a Curve Optimizer setting of -30 on all cores. However, when using this script, and with +0 MHz Boost Override, I needed to go down to -9 on one core to have it run stable (on the other hand, another core was still happy with a -30 setting even in this case).
When you start the script for the first time, it will copy the included config.default.ini to config.ini, in which you then can change various settings, e.g. which mode Prime95 should run in (SSE, AVX, AVX2, CUSTOM, where SSE causes the highest boost clock, because it's the lightest load on the processor of all the settings), how long an individual core should be stressed for before it cycles to the next one, if certain cores should be ignored, etc. For each setting there's also a description in the config.ini file.
As a starting point you could set the Curve Optimizer to e.g. -15 or -20 for each core and then wait and see which core runs through fine and which throws an error. Then you could increase the setting for those that have thrown an error by e.g. 2 or 3 points (e.g. from -15 to -13) and decrease those that were fine by 2 or 3 further into the negative (-15 to -17). Once you've crossed a certain point however there is no way around modifying the value by a single point up/down and letting the script run for a long time to find the very last instabilities.
By the way, it is intended that only one thread is stressed for each core if Hyperthreading / SMT is enabled, as the boost clock is higher this way, compared to if both (virtual) threads would be stressed. However, there is a setting in the config.ini to enable two threads as well.


